Warmer by nature
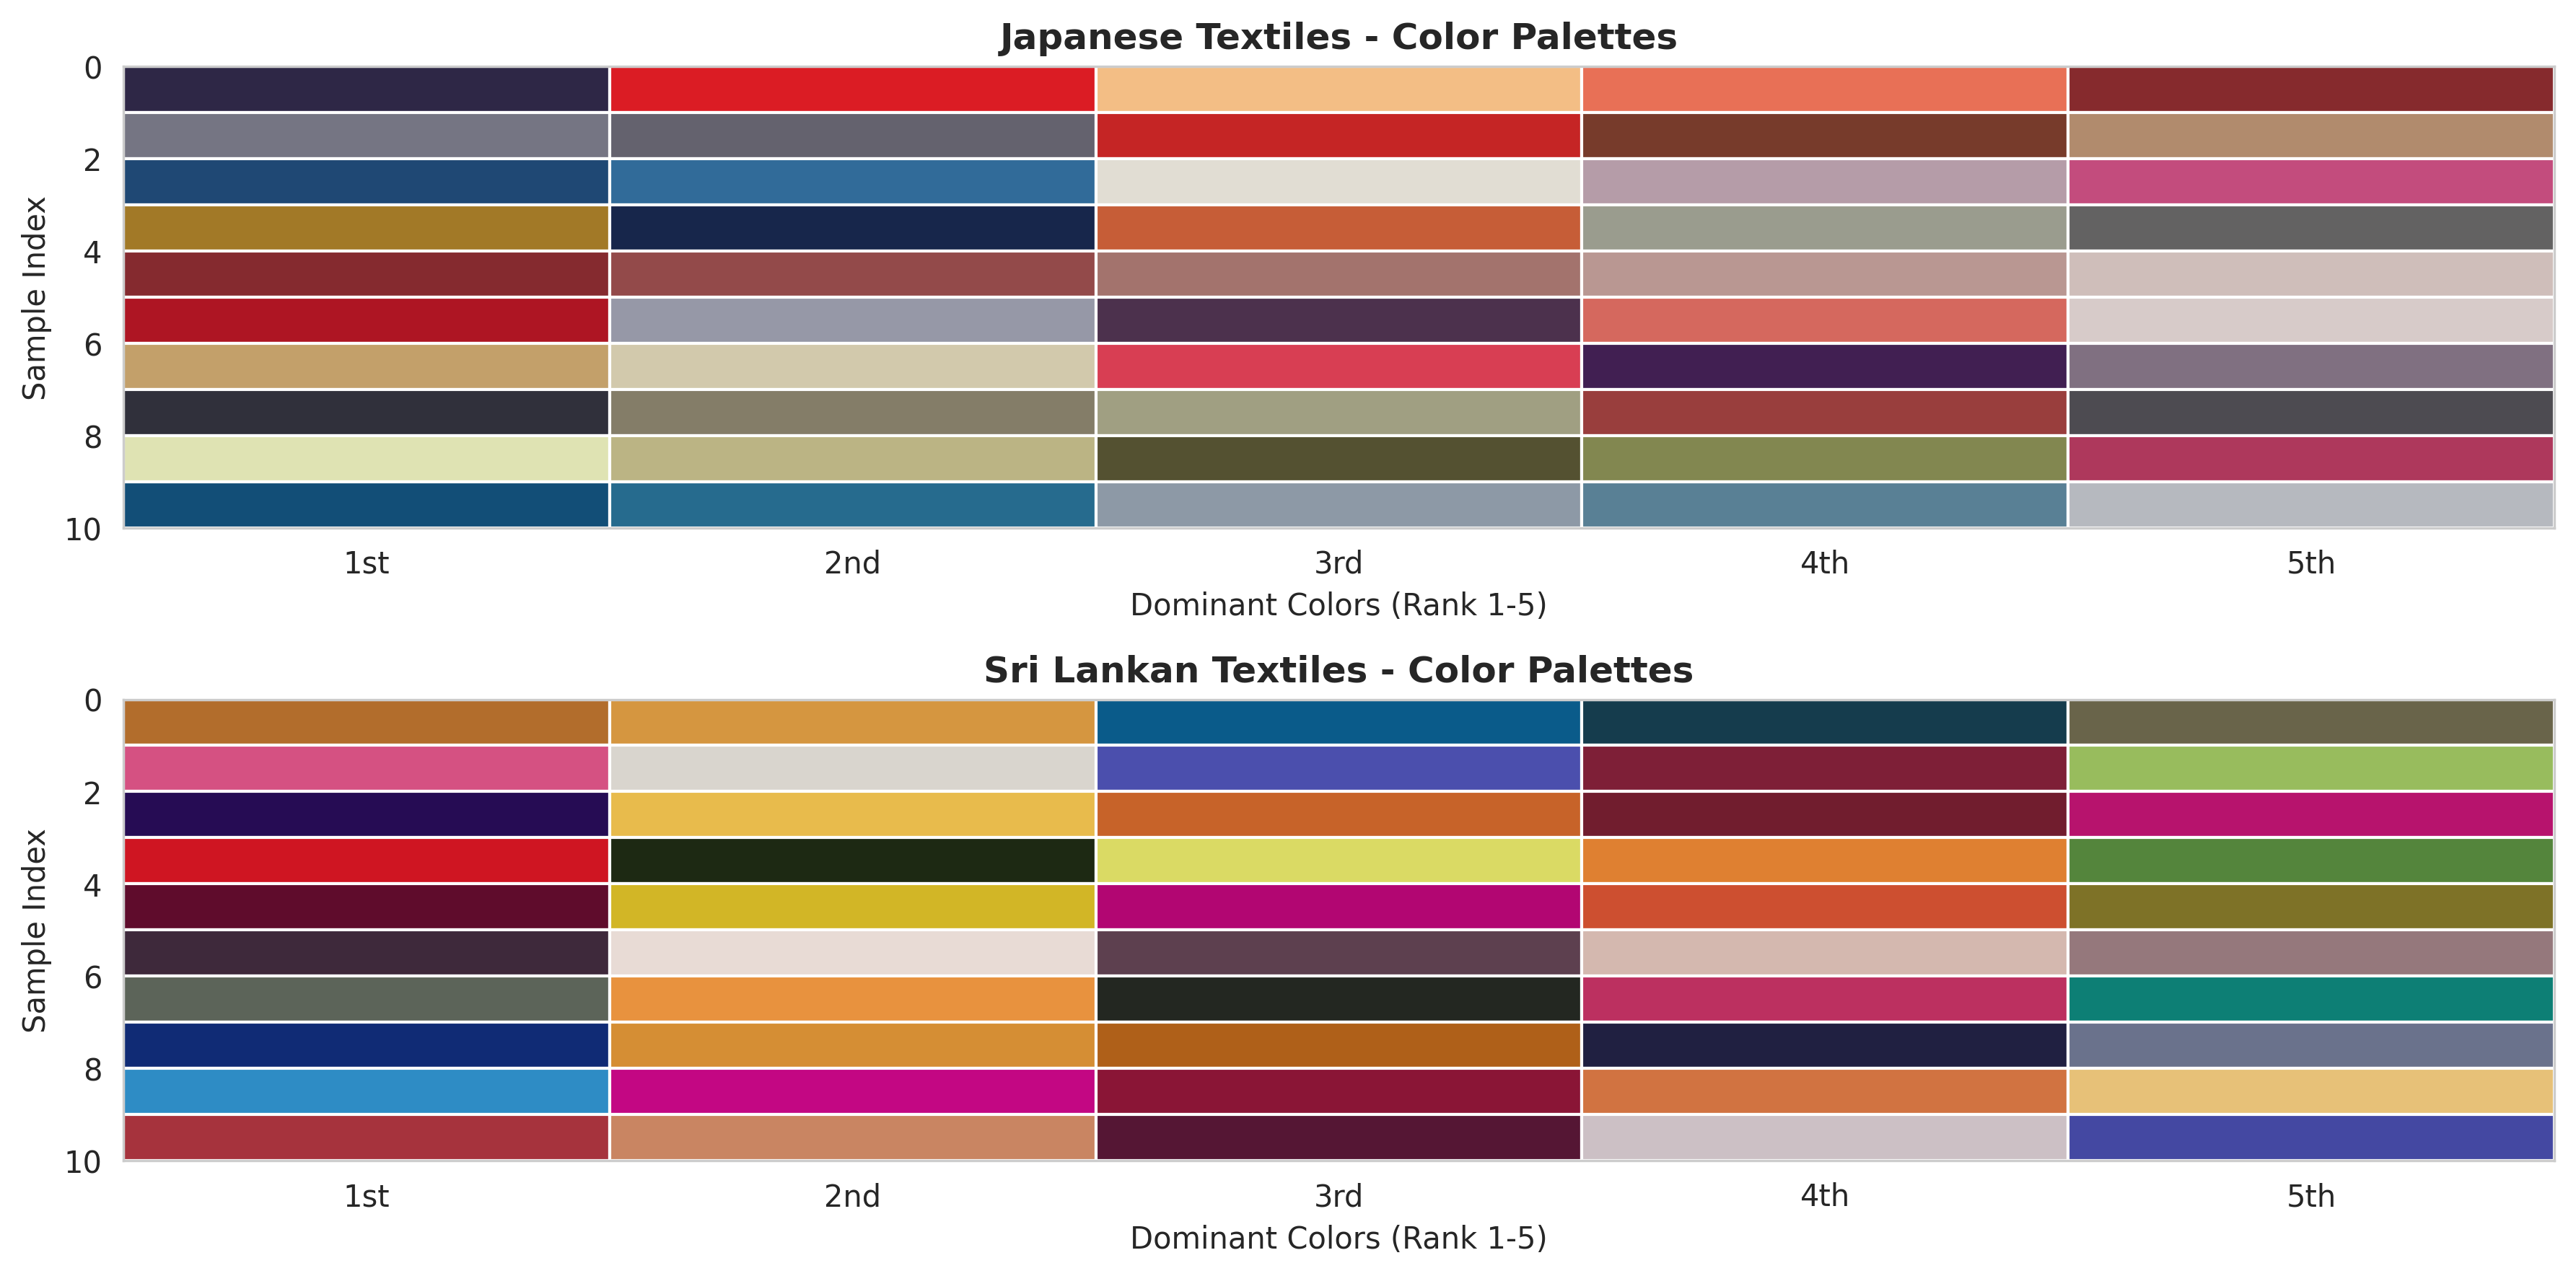
Sri Lankan textiles recorded a warmer colour profile, with a warm-cool score of 0.178 versus −0.111 in the Japanese set.
CROSS-CULTURAL TEXTILE ANALYSIS
JASPER maps the visual language of two textile traditions, turning colour, texture, motif and symmetry into evidence for design exchange.
WHY THIS MATTERS
For Sri Lankan handloom artisans, international relevance can coexist with cultural integrity. This research establishes a measurable vocabulary for understanding what Japanese and Sri Lankan textiles express differently, and where they can speak to each other.
OBSERVED DIFFERENCES
Image analysis indicates distinct, measurable aesthetic tendencies across the two collections.
Sri Lankan textiles recorded a warmer colour profile, with a warm-cool score of 0.178 versus −0.111 in the Japanese set.
Average saturation was the strongest single signature: 168.93 for Sri Lankan textiles and 102.05 for Japanese samples.
Texture, entropy, colour variance and symmetry create distinct visual rhythms, quantifiable across an image collection.
FROM WEAVE TO EVIDENCE
JASPER turns visual character into a reproducible analysis pipeline, making cultural pattern language legible without reducing it to a single score.
View reproducible codeJapanese and Sri Lankan textile specimens form the comparative corpus.
44 visual features capture colour, complexity, texture, symmetry and geometry.
Welch’s t-tests, effect sizes and correction identify meaningful signals.
Evidence becomes market-fit guidance and pathways for textile design.
CULTURAL SIGNAL EXPLORER
Richer saturation, warmth and visual variation form the Sri Lankan signature in the current sample.
PUBLICATION FIGURES
The study is open for reading, testing and extending. Browse the figures, source code and image dataset.
OPEN RESEARCH